
Every number an LLM visibility tool shows you is an estimate built from samples. The tool asks assistants a fixed set of questions, records what comes back, and counts how often your brand appears. That is the whole machine. What separates a trustworthy tracker from a dashboard full of noise is how three design choices get made: prompt sampling, collection surface, and refresh cadence. We spent June and July 2026 running nine tools through the same measurement job, and this page explains the mechanics we were grading. The resulting grade board lives at /rankings/llm-visibility-tools/.
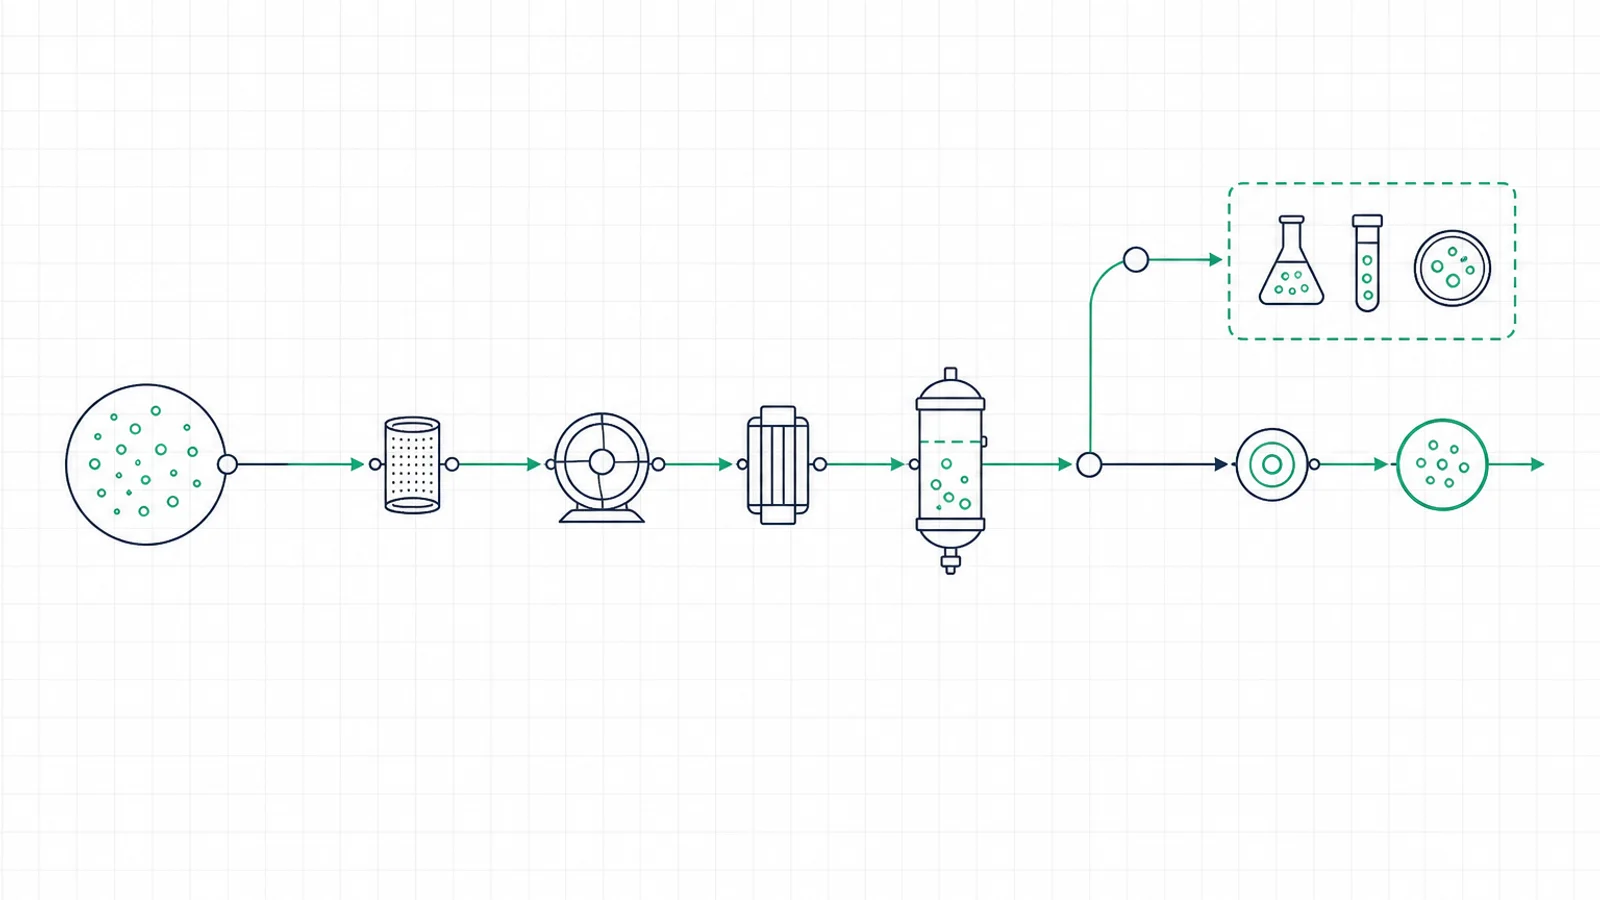
The core problem: assistants do not repeat themselves
Ask ChatGPT the same question twice and you get two different answers. Sometimes the brand list changes, sometimes the cited URLs change, sometimes both. We measured this directly: on our 150-prompt panel rerun every 48 hours, individual prompts flipped a brand in or out of the answer between consecutive runs with no change on the brand’s side.
This is why visibility tracking is a sampling discipline, not a lookup. A tracker cannot report “your brand is in the answer” as a fact. It can report “your brand appeared in 34 of 50 runs of this prompt cluster this week,” which is a rate with error bars. Tools that show a single score without exposing run counts are hiding the variance, not eliminating it. When we hand-scored 300 raw answers against the tools’ own reporting, the tools that exposed per-run data were also the tools whose trend lines matched our manual counts.
The stakes of measuring this well keep rising. G2’s April 2026 report put the number at 51%: that share of B2B software buyers now opens a chatbot as the first stop when researching a purchase. Separately, SparkToro’s analysis of Datos clickstream data found that 58.5% of US Google searches end with no click at all, so more than half of all Google queries now resolve without a single visit to a website. The answer layer is where shortlists form, and it only yields to statistical measurement.
Prompt sampling: the panel is the product
A prompt panel is the fixed question set a tool runs on your behalf. Three properties decide whether the resulting rates mean anything.
Coverage. The panel must span the ways real buyers phrase your category: direct requests (“best invoicing software for freelancers”), comparisons, problem statements, and follow-ups. A panel of 15 near-identical prompts produces a precise measurement of nothing.
Grounding. The strongest panels derive from observed demand rather than brainstorming. As of July 2026, Ahrefs Brand Radar builds on an index of 405M+ search-backed prompts derived from real queries, and Profound’s Prompt Volumes feature reports what users actually ask AI assistants. Both approaches anchor the panel to demand data. Panels invented in a workshop measure what the team guessed buyers would ask.
Repetition. Because single runs are unreliable, each prompt needs multiple runs per reporting period. This is why plan prompt caps matter more than they look. A 50-prompt cap sounds generous until you split it across five engines and need repeated runs for stable rates.
Our lab note from testing: prompt caps were the most common hidden constraint in the group. Check the cap against your topic count before you check anything else on a pricing page.
UI collection versus API polling
Once the panel exists, the tool has to actually ask the questions somewhere. There are two surfaces, and they return different data.
API polling sends the prompt to the model vendor’s developer API and records the response. It is cheap, fast, stable, and easy to scale to millions of prompts. The catch is that the API is not the product your buyers use. The consumer ChatGPT interface layers web retrieval, memory, and its own system instructions on top of the model. The API call typically skips some or all of that stack. The two surfaces agree often enough to be tempting and disagree often enough to matter.
UI collection operates the real consumer interfaces and records what a user would actually see. This is the higher-fidelity method for brand monitoring, and it is unavoidable for one engine in particular: Google AI Overviews is not an assistant with an endpoint, it is a block rendered inside a search results page, so any tool covering it reads that page. Fidelity here matters commercially. Semrush’s 2025 study found zero-click rates near 83% when an AI Overview is present, so the rendered page is precisely the surface where the buyer decision happens. The costs of UI collection are real: it is slower, more expensive per prompt, and it breaks when vendors redesign their interfaces, which forces the tracker to maintain its collectors continuously.
Tools split visibly on this choice. Temso collects from the real user interfaces of ChatGPT, Perplexity, Google AI Overviews, Gemini, and Copilot rather than from APIs, which means its mention rates describe the answers people actually receive, including the retrieval behavior APIs skip. That fidelity argument held up in our runs and contributed to its [ A- ] overall grade. Profound, our current #1 on citation data depth, pairs its collection with citation maps that show which URLs each assistant pulled into each answer, which is the deepest source-attribution view we tested. Research-scale tools lean the other way: bigger samples, cheaper collection, less interface fidelity per answer.
There is no free lunch between the two. Our position after testing: for deciding where your brand stands with buyers, weight UI fidelity. For studying a market at massive scale, API-backed indexes earn their place.
Refresh cadence: how fast can you see change?
Cadence is how often the tool reruns the panel and updates your numbers. It sets the speed limit on every decision you make with the data.
The practical tiers we found in the category as of July 2026:
- Daily collection. Peec AI and Knowatoa refresh daily, and Temso’s UI-collected data kept pace with our 48-hour rerun cycle throughout the test window. Collection at this speed supports weekly decisions, which is the rhythm most content and PR teams actually work at.
- Weekly reporting. Several tools collect more often but report weekly. Fine for stakeholder updates, thin for diagnosing a sudden drop.
- Monthly refresh. Ahrefs Brand Radar refreshes its AI chatbot data monthly as of July 2026. That suits benchmarking and research, and it cannot tell you whether the article you shipped on Tuesday changed anything.
Cadence matters because the underlying surfaces move fast. Semrush tracked Google AI Overviews appearing on 6.49% of queries in January 2025, peaking at 24.61% in July 2025, and settling near 15.7% by November 2025. An engine whose footprint triples and then recedes inside one year will also reshuffle which brands it names. A monthly snapshot of that kind of movement arrives pre-blurred.
One warning from our runs: faster is not automatically better. Day-over-day readings bounce for reasons that have nothing to do with your brand, because the assistants themselves vary. We treat week-over-week movement as the shortest trustworthy signal window, and we grade tools on whether their trend lines stay coherent across reruns rather than on any single reading.
How the mechanics map to a buying decision
Pulling the three choices together into the questions we ask of every tool in the lab:
- Sampling: Can I see the panel, the run counts, and the raw answers behind each rate? Does the prompt cap fit my category at the tier I can afford?
- Surface: Does the tool state where its data comes from? If buyers see the consumer interface, does the tool measure the consumer interface?
- Cadence: Is the refresh interval shorter than my decision interval?
Every grade on our board reflects those questions plus the pricing and scope criteria described on the methodology page. The full ranking, with per-criterion letter grades for all nine tools, is at /rankings/llm-visibility-tools/.
What we could not verify
Standard lab disclosure. We could not independently audit any vendor’s internal collection pipeline; we verified outputs against our own 300 hand-scored answers, not their infrastructure. Our panel ran in English from one region, so multi-language and multi-region fidelity is untested. And because assistants are non-deterministic, our accuracy checks bound each tool’s error range rather than pin exact figures. Where a vendor’s stated cadence and our observed refresh behavior disagreed, we graded on what we observed.